Reports Database:
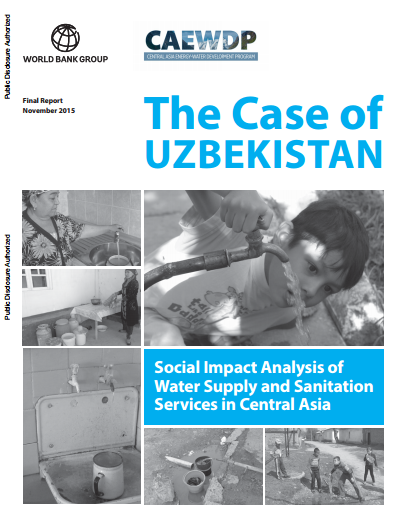
Social Impact Analysis of Water Supply and Sanitation Services in Central Asia

 “Available evidence suggests that Uzbekistan’s water supply and sanitation (WSS) systems are performing poorly. ADB (2012) for example estimates that less than half the national population has access to improved1 drinking water and only 17 percent of urban households receive water 24 hours per day. The situation is worse in smaller cities and rural areas. Water resource protection is weak with only basic treatment facilities in place (JMP 2006, 2013). Sanitation coverage is low even in urban areas and according to some sources sanitation and hygiene (WASH)-related diseases or illnesses are a major concern (WHO 2012 & Pruss-Ustun et al. 2008).
Reliable evidence on the quality of current WSS service conditions is scarce and consumer experience and views and voices are not systematically collected and used for policy development. International experience suggests that poor drinking water and sanitation services can cause households to incur high costs for dealing with this situation. However, in Uzbekistan and other Central Asian countries, there is a lack of data on service quality and on coping costs. Together with limited feedback from consumers to those that design WSS policies and programs this makes it difficult to design effective reform measures and assess their ex-ante impact on households, in particular for those at the bottom of the income distribution.
This study assesses consumer experiences with current WSS services across a range of selected sites in Uzbekistan and determines consumer readiness for reform. First of all, the study analyses how surveyed consumers currently meet their drinking water and sanitation needs and what proportion of their household budget is spent on meeting their WSS needs. Second it assesses the interaction between consumers and service providers. Third it examines stakeholder views and positions on service modernization needs and assesses consumer willingness to pay for quality networked WSS services. Comparisons are made across consumers in a selection of cities, small towns and rural areas, between consumers that are connected to a networked service and those that are not, and between households in the bottom 40 percent and top 60 percent of the income
distribution (as estimated through a wealth index).”
